How to debug Angular in VS Code (2 Easy Steps)
Today I'm going to be quickly showing you how to do debugging efficiently in VS Code for your angular application.
A lot of people still do console.log() for debugging.
Even in VS Code.
Now what's the point of using console.log() when you have Angular debugging capabilities in VS Code?

So this guide is for Angular devs who are still stuck with console log.
I'll show you how you can set up debugging in VS Code for your Angular project.
1. Creating the project
First we're going to create a quick demo project with the Angular CLI.
ng new debuggingNow that our project is initialized I'm going to open it in VS Code.
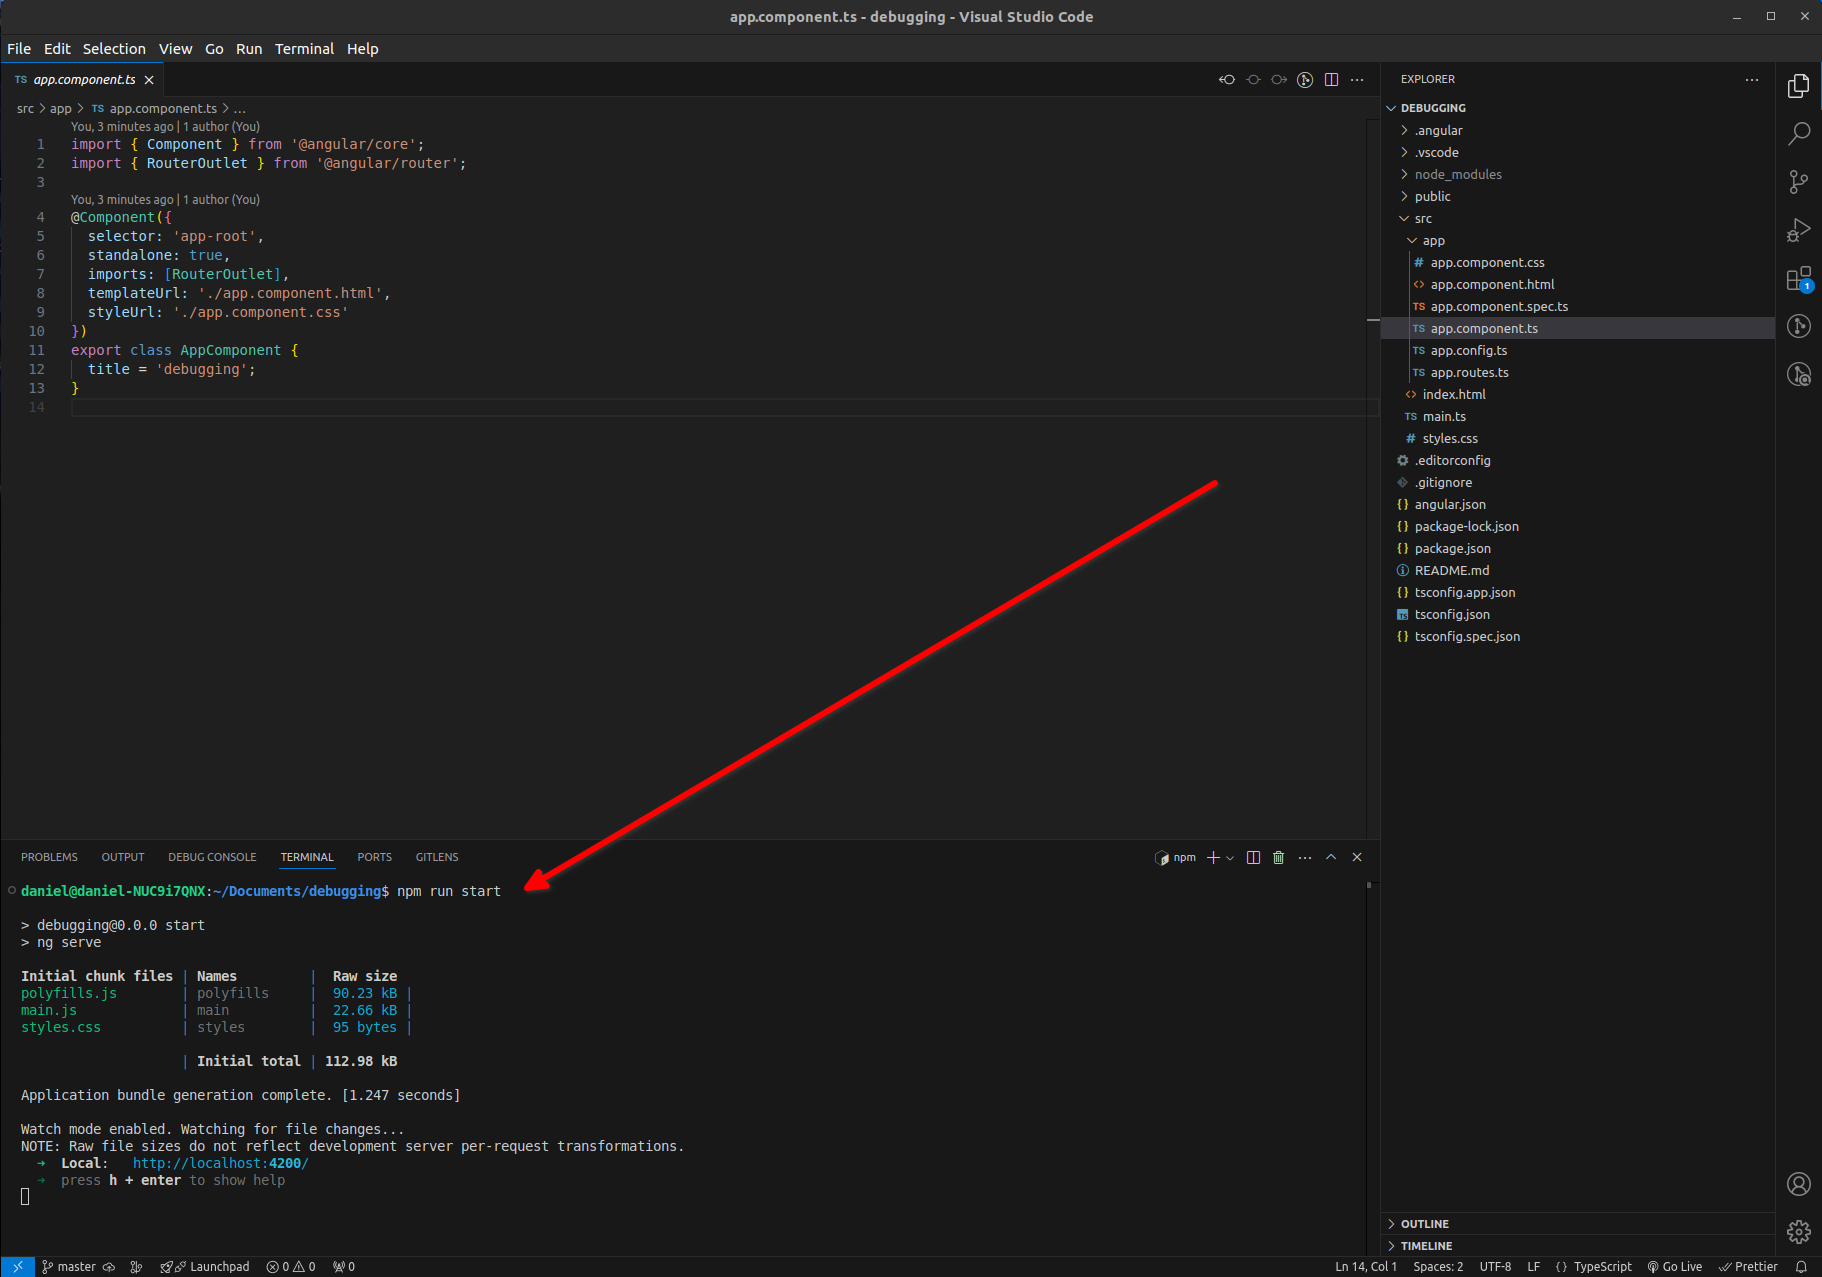
Let's start our project by running npm run start.

Now our project is up and running so if we open a browser and to http://localhost:4200 we'll see the default Angular application.
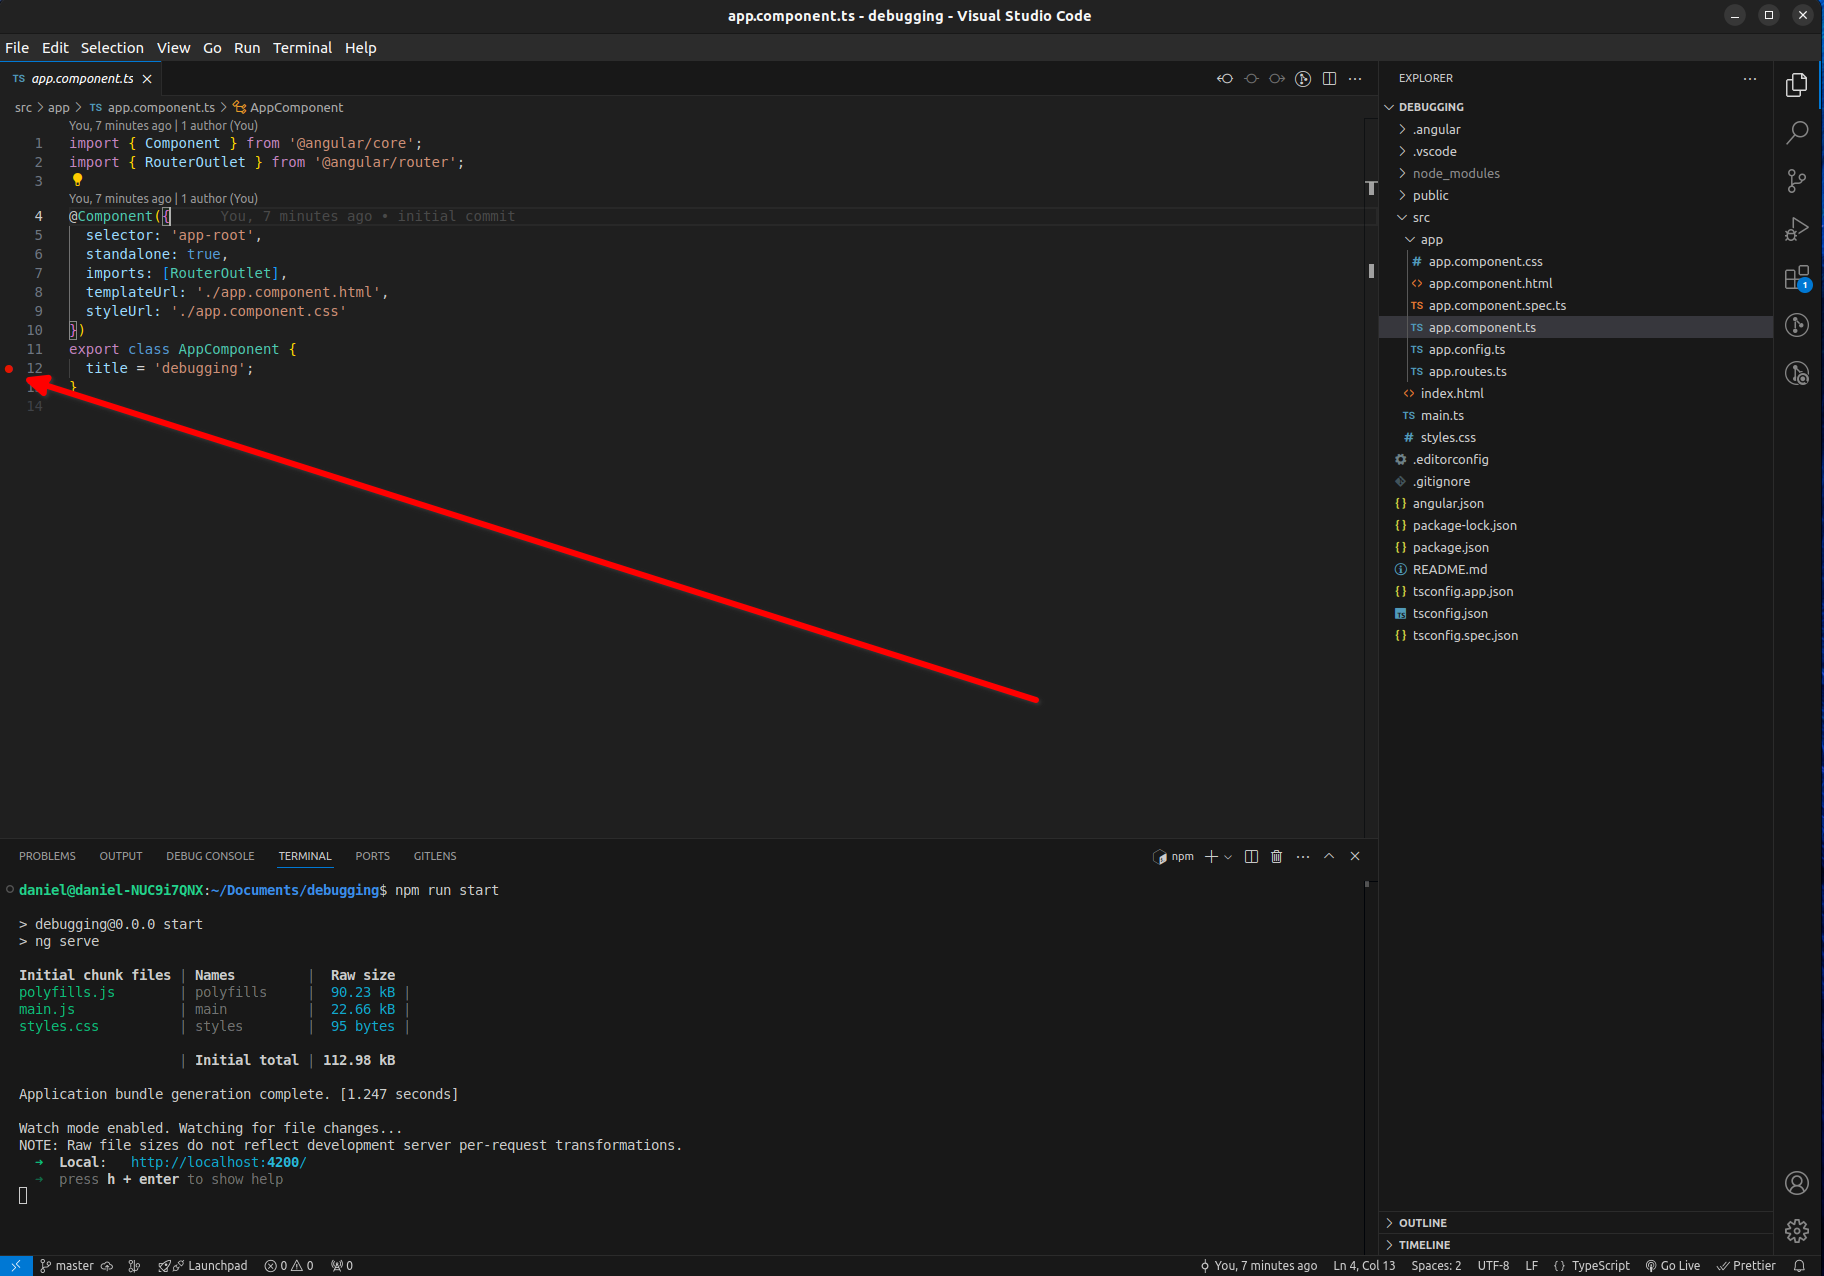
Now we'll go back to VS Code and add a debugging break-point in the app.component.ts.

But when we refresh the browser the break-point doesn't actually trigger in VS Code.
Why?
2. Adding the debug configuration in VS Code for Angular
We need to use the VS Code debugging feature to add a debug config for our Angular project.
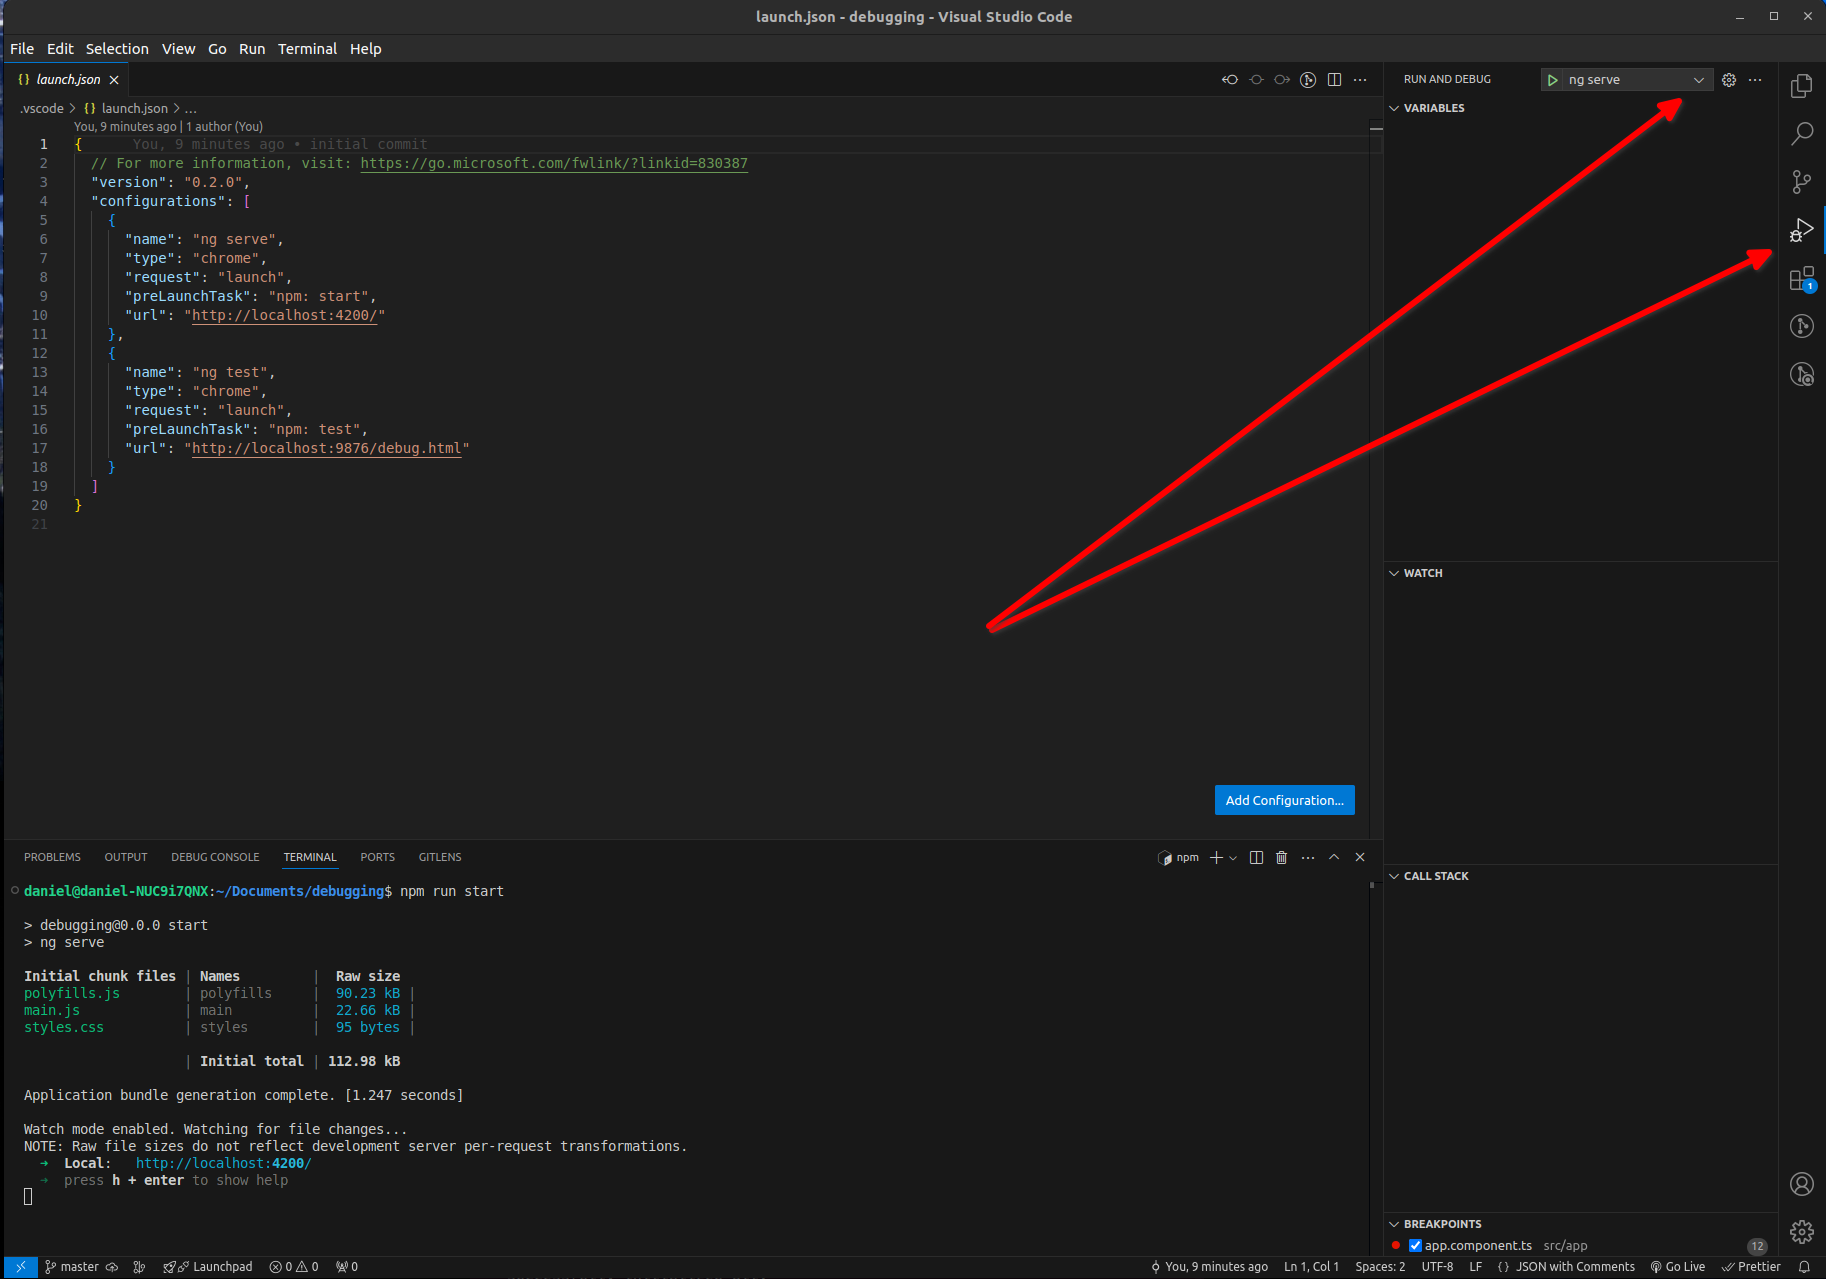
We'll click on the debug tab in VS Code. This is usually on the left or right side of VS Code with a bug icon.
And then we'll select the debug configuration drop-down and select "Add Configuration".

This will show us a drop-down list of all kinds of different options inside the launch.json file.
We'll choose the "Launch Chrome" configuration and change the url to http://localhost:4200.
Our configuration should look like this when we're done.
{
  "version": "0.2.0",
  "configurations": [
    {
      "name": "Launch Chrome",
      "request": "launch",
      "type": "chrome",
      "url": "http://localhost:4200",
      "webRoot": "${workspaceFolder}"
    }
  ]
}
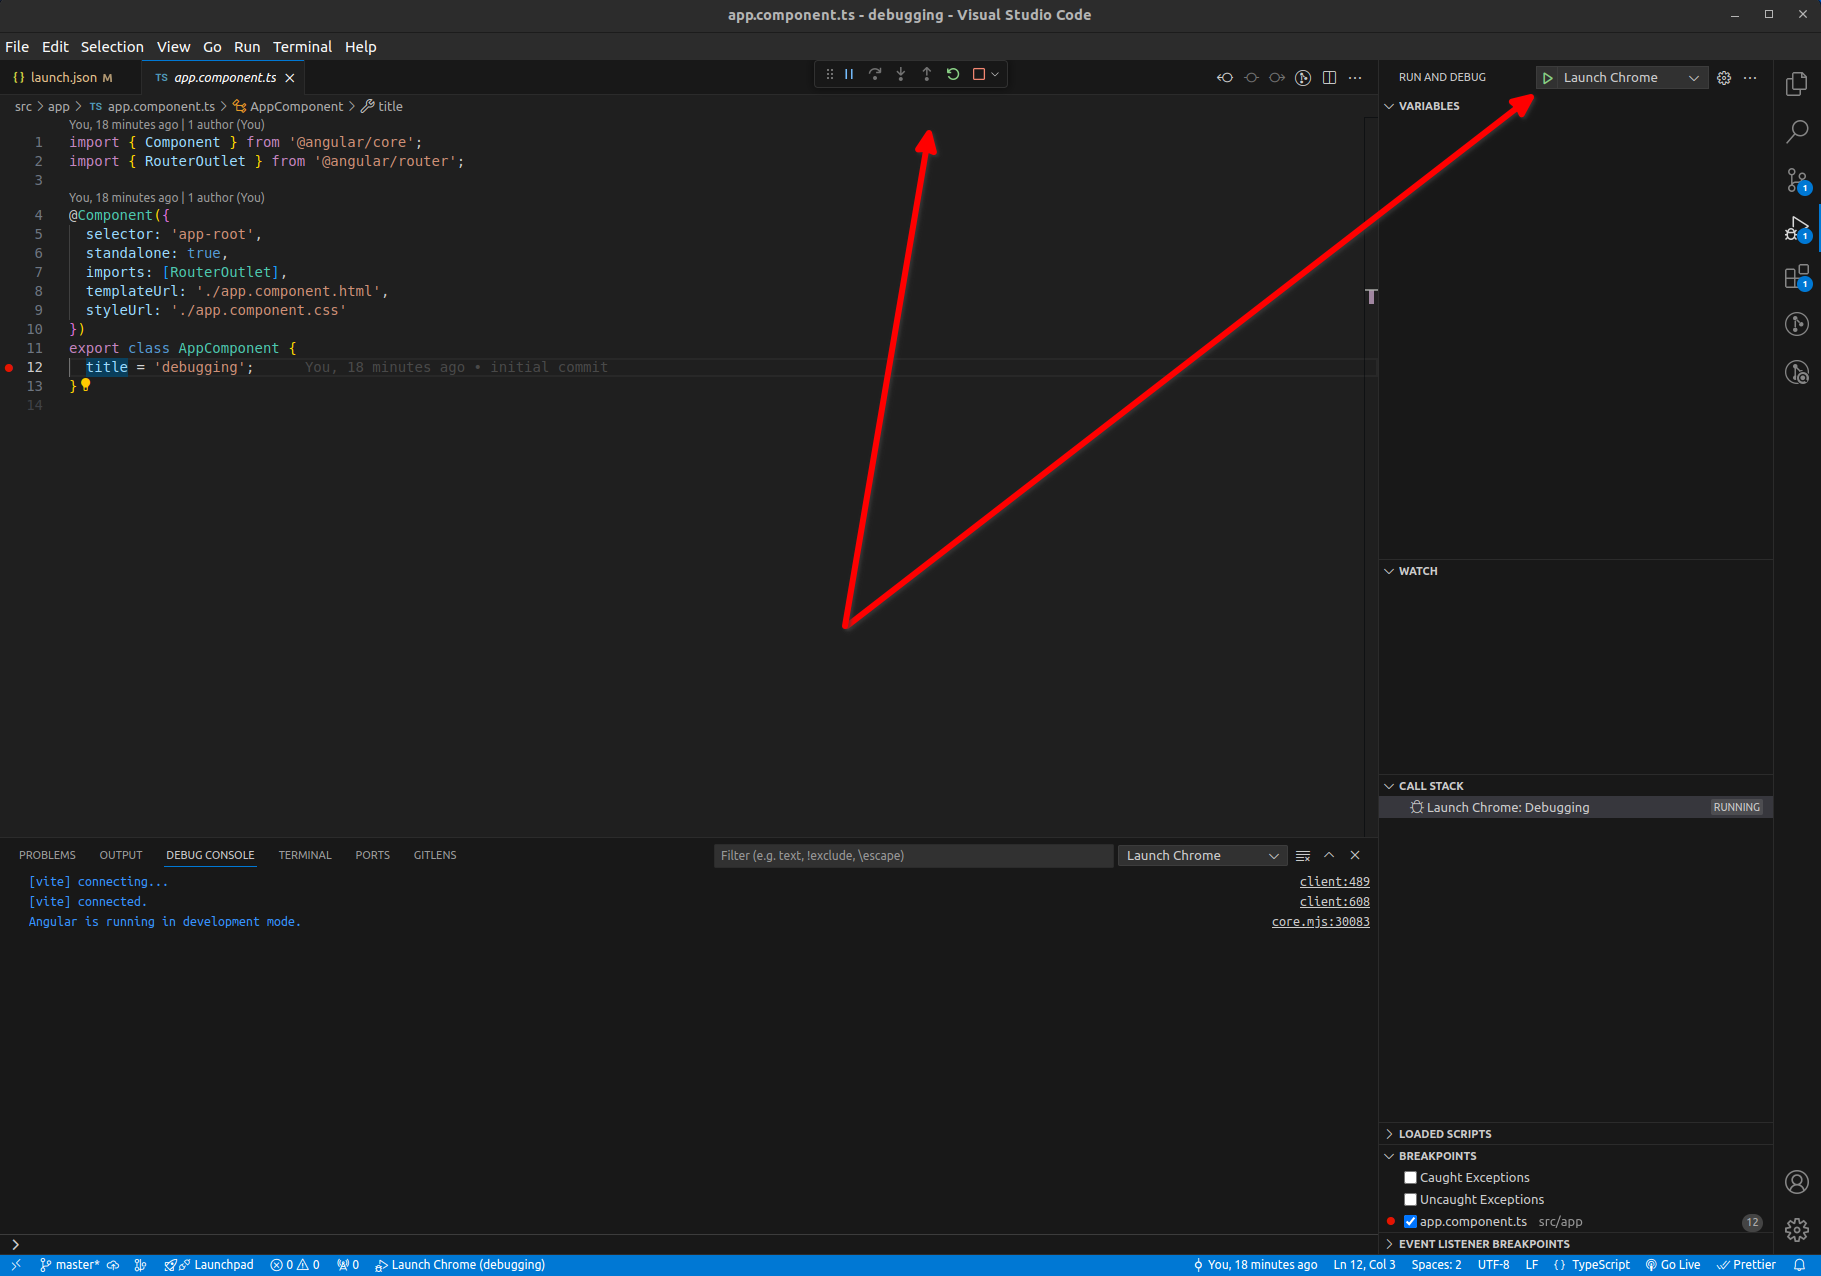
Now you can go into the configuration list and select "Launch Chrome" by clicking the play button.
This will create a new instance of Chrome, load your Angular app, and look for all the break points.

Conclusion
So that's a quick tutorial about how to easily do debugging properly in Angular using VS Code.
There's no reason to constantly write out console.log() because that's just a time waster when you can use a break-point directly in your code.
Till next time,

Daniel Kreider - Angular Developer
