Angular: How to profile runtime performance
Performance problems are aggravating. 😠
As aggravating as being crammed into an airplane seat with broken glass in your underwear.
And all the more so when you don't know what's causing them.
...
So how do you profile an Angular app and discover what's causing your runtime performance to be sluggish?
Where do you even start?
And once you've found a performance issue how do you fix it?
One way to do this is to hire an Angular expert to do a performance audit on your Angular app.
Or you could check out my whopper article about how to fix Angular performance issues.
But before you can fix a performance problem you first have to find the Angular runtime performance problems.
So where do we start digging? ⛏ ⛏ ⛏
What causes Angular runtime performance problems?
An important consideration that may not be overlooked is that just because your Angular app is slow doesn't mean that the slowness is caused by the Angular framework.
I've seen Angular apps with runtime performance problems caused by 3rd-party libraries imported into the Angular app.
When you're Angular app is sluggish with issues like...
- background processing
- slow HTTP requests
- poor-performing API servers
- improper Firebase queries
...and a host of other poorly configured tasks it makes your Angular app impossible to be responsive. And these types of performance issues only cry louder when your Angular app is used on mobile devices with limited processing power and poor connectivity.
At the same time, it's possible that runtime performance issues are being caused by the Angular framework. And that the Angular framework needs to be tweaked for optimal performance such as improving change detection.
But first, let's learn how to use profiling tools to find the cause of runtime performance issues in our Angular application.
Enabling and using the Angular debug tools to profile change detection performance
A common runtime weakness in Angular is the change detection mechanism that's used to bind data between your template file and your code.
Weakness? Well... maybe more like a cool feature that too many of us are good at misusing. 🤓
So how do profile Angular's change detection mechanism to find out if it's the cause of your runtime performance issues?
The first step is to open the main.ts file and enable the built-in Angular debug tools.
import { ApplicationRef, enableProdMode } from '@angular/core';
import { enableDebugTools } from '@angular/platform-browser';
import { platformBrowserDynamic } from '@angular/platform-browser-dynamic';

import { AppModule } from './app/app.module';
import { environment } from './environments/environment';

if (environment.production) {
  enableProdMode();
}

platformBrowserDynamic().bootstrapModule(AppModule)
  .then(moduleRef => {
    const applicationRef = moduleRef.injector.get(ApplicationRef);
    const componentRef = applicationRef.components[0];
    enableDebugTools(componentRef);
  })
  .catch(err => console.error(err));
Next we'll run our Angular app with the serve command.
ng serve --openAnd once it's launched in the browser and loaded we'll open the Console tab of our web developer tools. Inside of the Console we'll run the following command to do some change detection profiling.
ng.profiler.timeChangeDetection()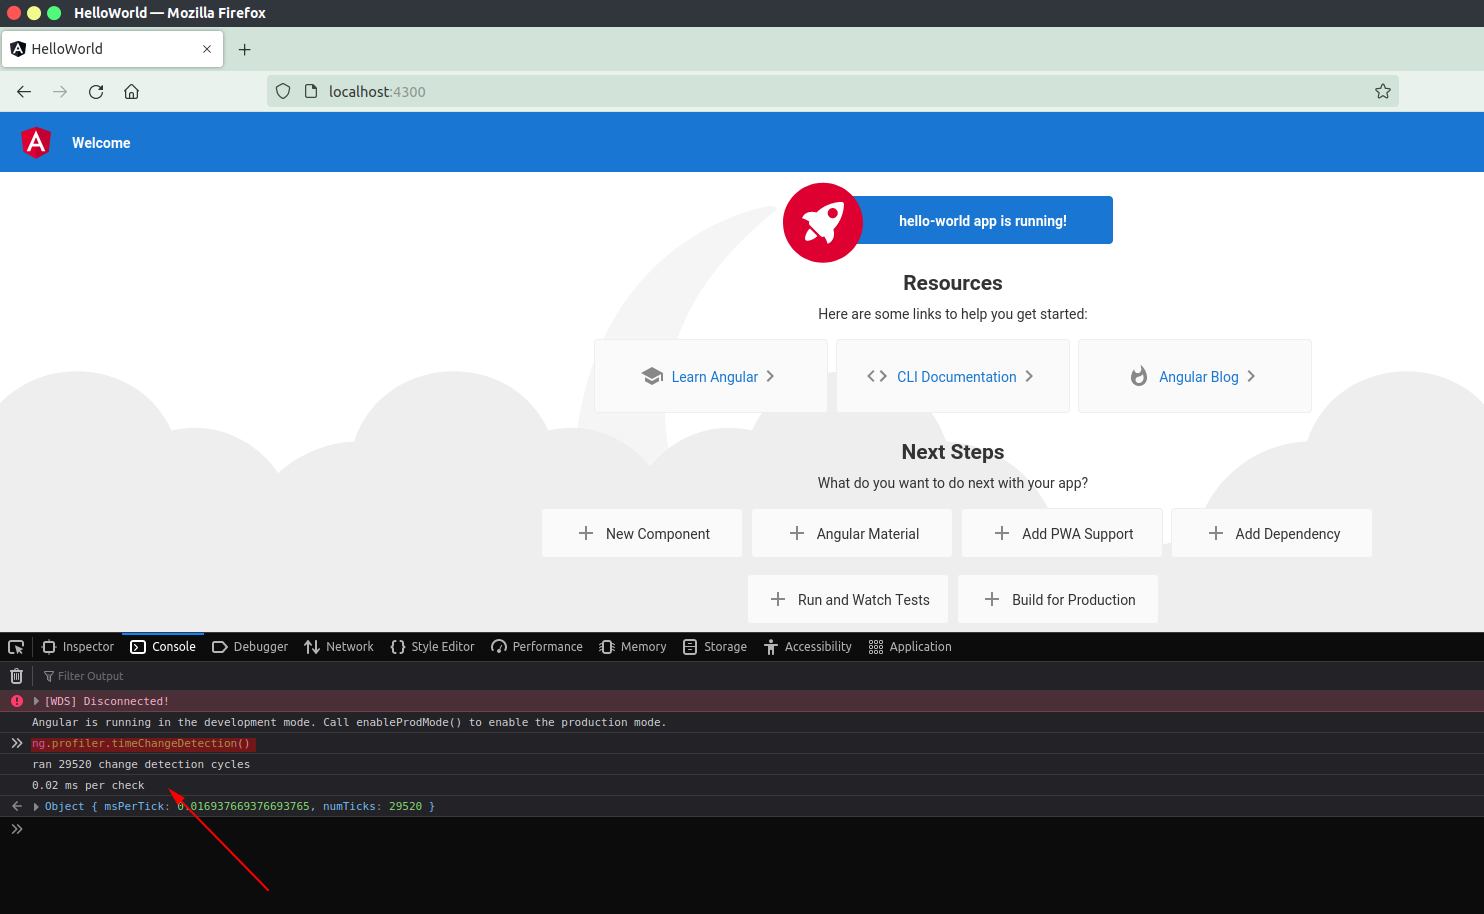
But what does that function exactly do?
It's a bit of a mystery because there is no official documentation (as of this writing) for this function.
But from the best we can tell so far it tells Angular's change detection to run for about 500ms and then prints how many times change detection was triggered and the average time change detection took.
If you're suspicious that a specific page in your Angular app is causing change detection overload then this is a quick and dirty way to do some change detection profiling.
But what if you want some more advanced change detection monitoring?
Or even a better way to profile the runtime performance of your Angular app?
That's where the Angular DevTools extension really shines.
How to profile your Angular app with the Angular DevTools extension
Did ya know that the Angular framework has its own extensions?
And it's a popular tool with over 300,000 users!

It was created for the Chrome browser and adds specific Angular debugging and profiling capabilities. It's a really cool tool and has helped me out of multiple pinches.
To begin profiling the performance of your Angular app with this cool extension you'll have to first go to the Chrome web store and download it.
Once installed, open your developer tools and you should see a new tab called Angular. If you don't see it click on the 3 dots on the right-hand side, then click on More Tools and you should see it in that list.
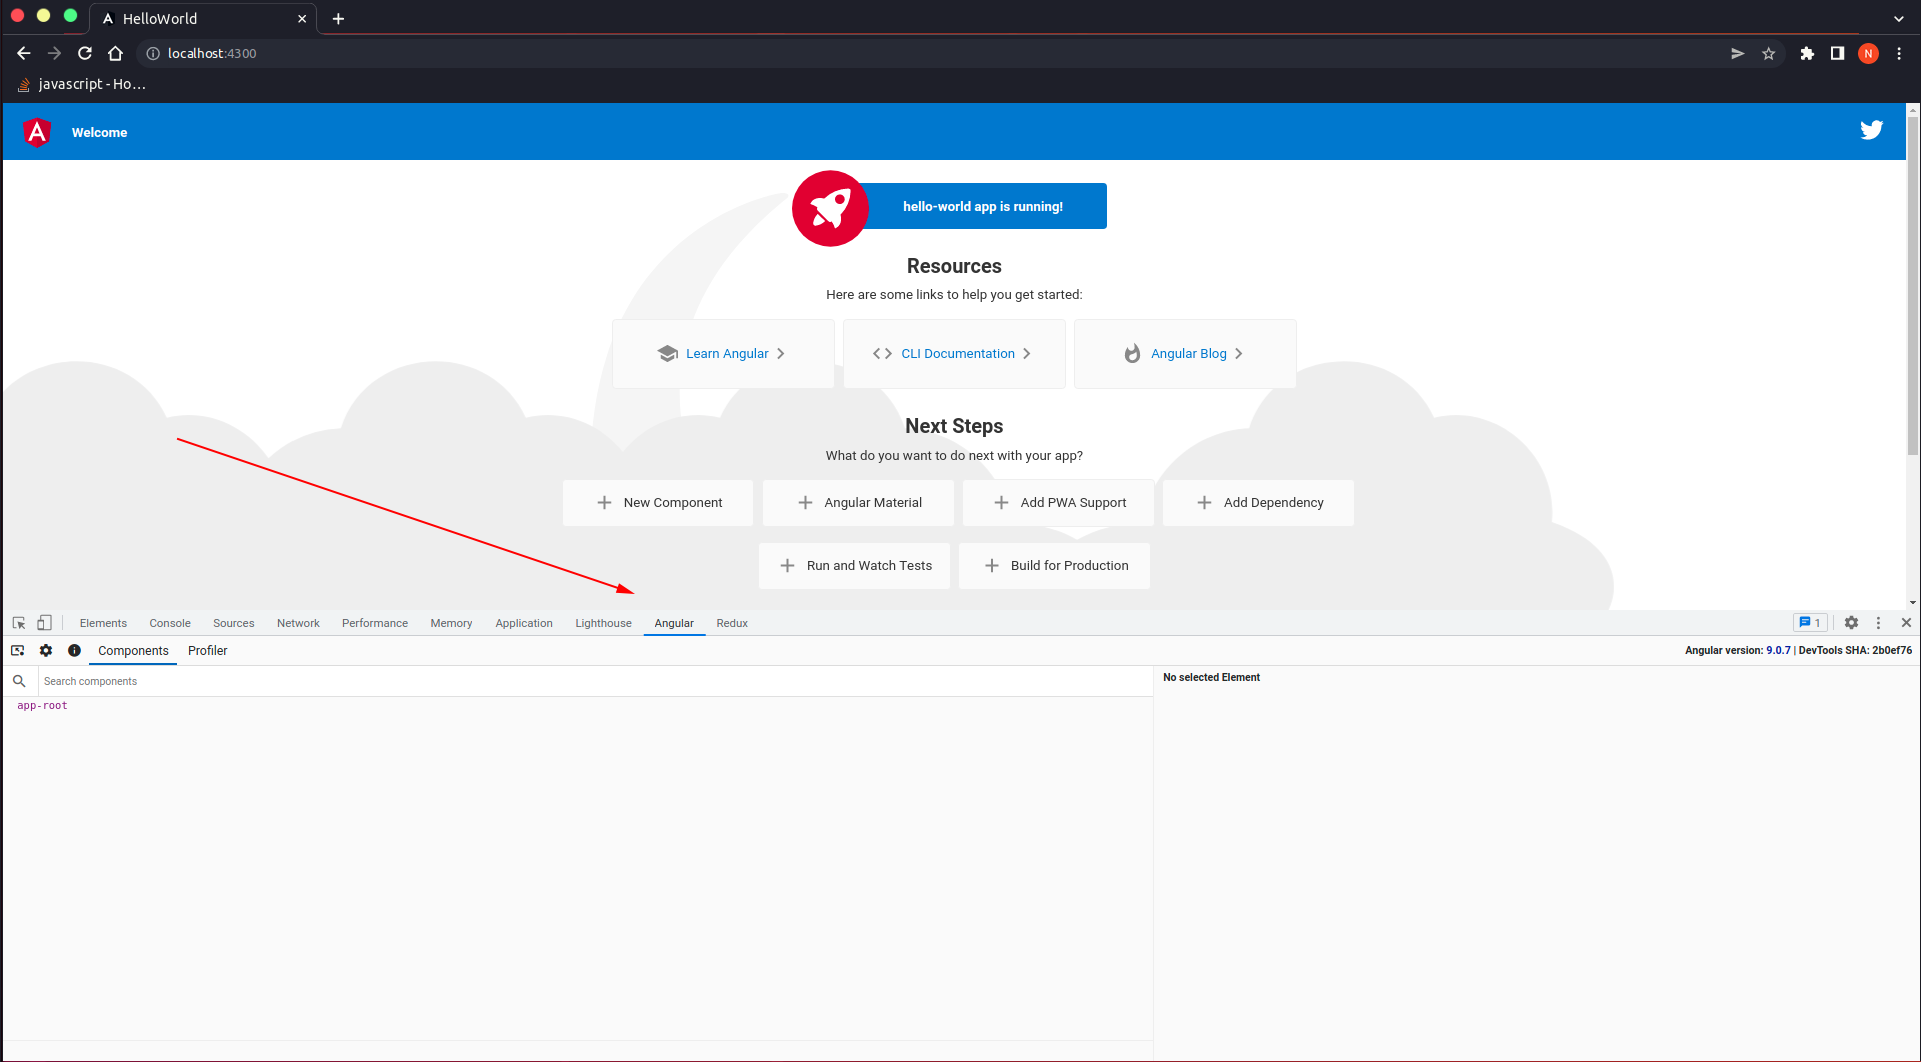
There are two tools you can use.
- Components (Used to view the rendered structure of your Angular components).
- Profiler (Used to profile Angular change detection).
We're interested in the 2nd tool - the profiler.
You'll want to click on Profiler and then click on the record circle to begin recording and profiling Angular change detection.

While it is profiling the performance of your app you need to be clicking around in the places where your Angular application is being slow.
Once done, click the stop button and you should see a graph similar to the one below.

Every bar on the graph represents a change detection cycle.
The short green bars mean that change detection was quick and well-performant. Whereas the yellow and red status bars indicate that change detection took longer than it should've and indicate a performance problem.
You can further investigate by clicking on one of the bars to discover where the change detection was initiated and possible causes of slowness. You can also filter the results to find the slowest ones and investigate only those.

Using Chrome's performance profiling tools
If you've tried using the tools above and still haven't gotten to the root of your performance issues then it's time to dust off a powerful tool.
...drum roll please...
🥁 🥁 🥁
...
🥁 🥁 🥁
...and...
...welcome to...
The Powerful Chrome Profiler - a tool that I love and despise.
If you're having to pull the Chrome profiler out to profile your Angular app then it's not unlikely you've got a complicated runtime performance issue that's deeper than the Angular framework.
The first step is to load your Angular app in a Chrome browser. And next get ready to trigger the performance problem you're experiencing.
Then you'll want to open Chrome's developer tools and select the Performance tab.
Click the record button when you're ready to start profiling the performance of your Angular app.
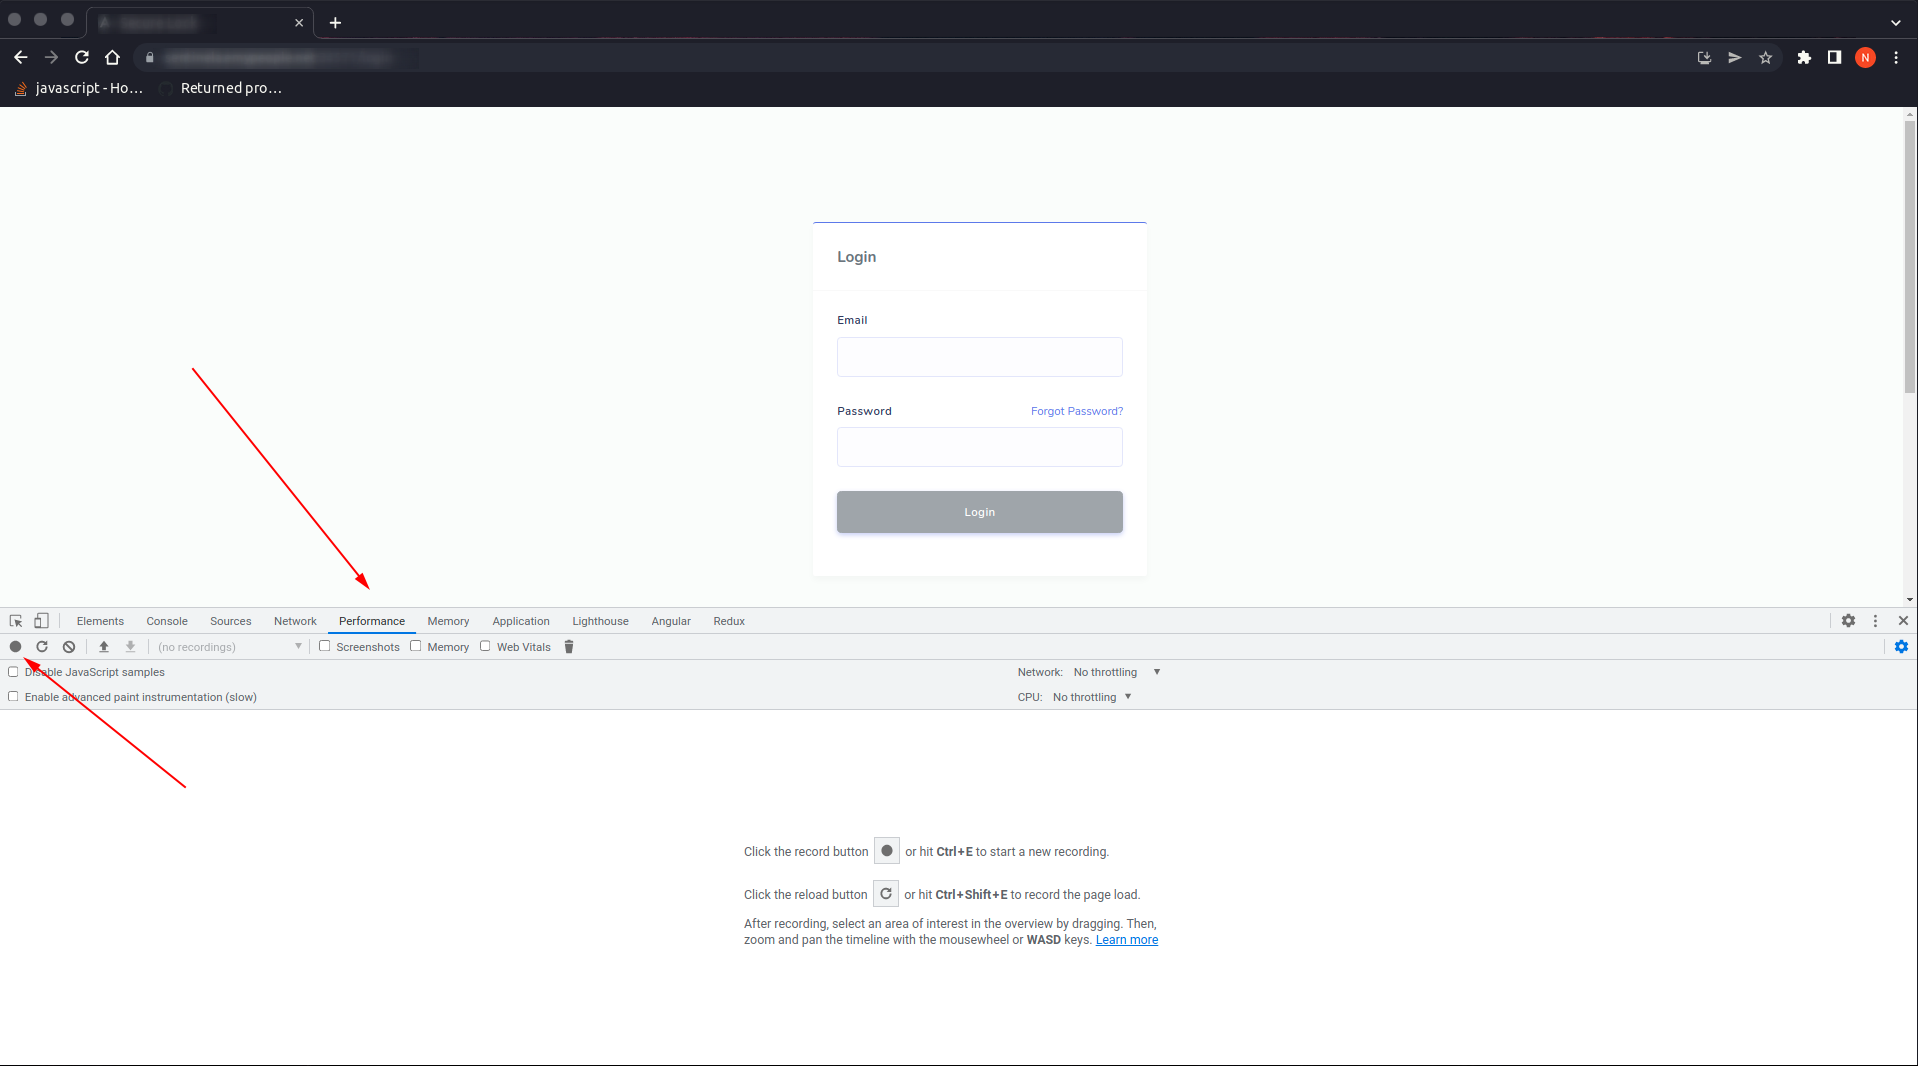
It'll begin profiling your Angular application while you interact with it. Now is the time to trigger any performance bugs in your application.

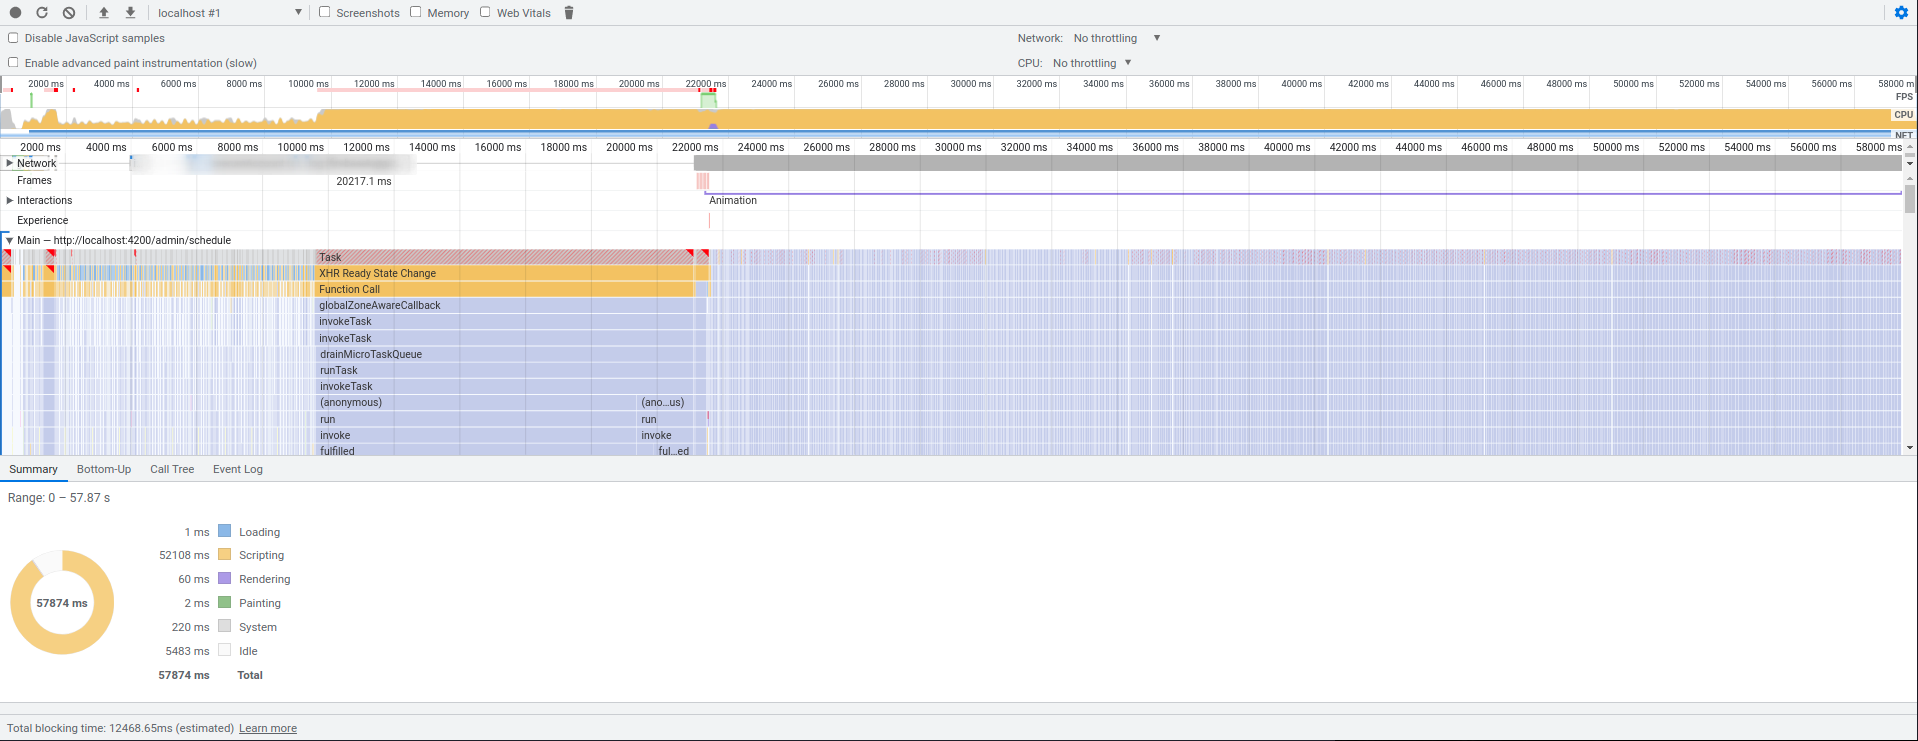
Once you're done, click on the Stop button and you'll be shown various charts revealing how your app performed.
Explaining the various charts and how to read them all is beyond the scope of this article. Plus, Minko has created a great video that explains the Performance tool and flame graphs, etc... in depth (see below).
However, here are a few pointers.
- When profiling an Angular app with Chrome's performance tool you'll want to look for any red bars at the top of the graph.
- Click on those to find out how long a task was ruining the performance of your app.
- You can also drill down into the various function calls, etc... in the Main graph.
- When inspecting a function or task, keep your eye on the Summary tab at the bottom of the browser to see if it tells you more information about the initiator.
Performance graphs will vary a lot so you might wonder what other Angular apps behave like and what kind of performance charts they generate?
Well, here's a snapshot of a well-performing Angular app.
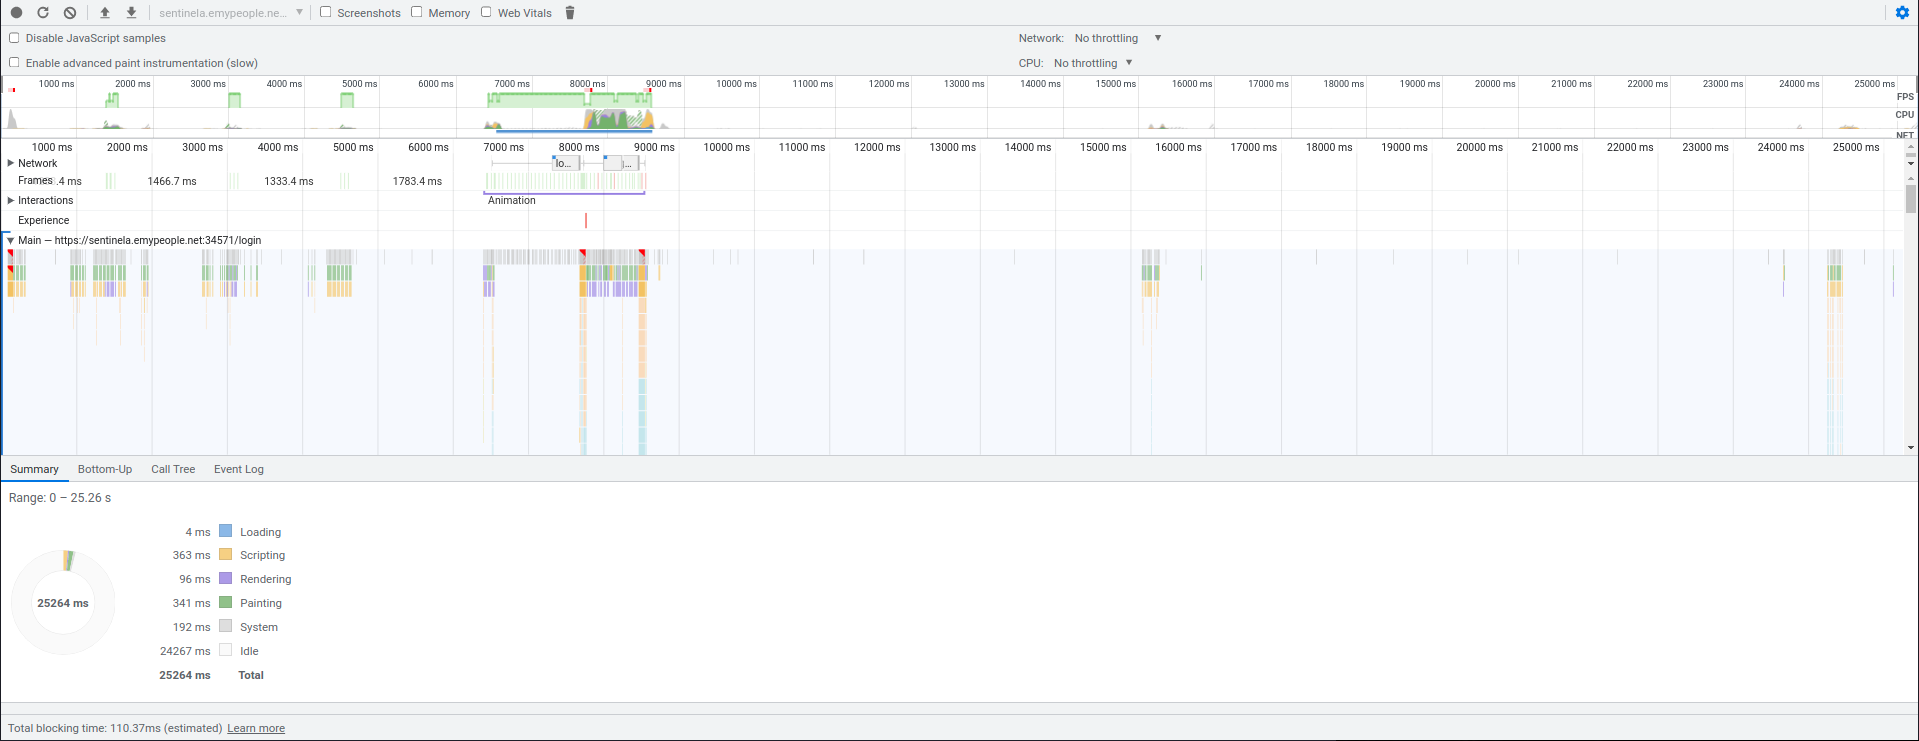
And a snapshot of one that was behaving poorly due to a 3rd-party library.
Which tool should I use to profile my Angular application?
Personally, I think the Angular Devtools extension is a pretty cool tool to keep handy.
It's the first tool I grab when I need to dig into Angular performance issues.
Other than that, Chrome's profiling tools are handy for digging deeper.
Which tool do you like to use? And why do you like it?
Let me know in the comments below.

Angular Consultant
P.S. - Need an Angular expert to audit the performance of your Angular app? I've got a few slots left.
