Angular Code Coverage (How to measure and use)
Today we're going to show you how to set up code coverage in your Angular project.
If you set up code coverage you will have a realistic understanding of how solid your code is.
And when you test right... you will sleep tight.

By configuring and using the Angular code coverage tool you will consistently ship a stable product.
First of all, code coverage is a percentage of the code that gets tested when we run our suite of Angular tests.
The higher the code coverage result suggests your code base has a lower chance of undetected software bugs - compared to a program with low code coverage.
Some of the benefits of code coverage are:
- Catch bugs before they catch you.
- Refactor your code with confidence.
- A badge of professionalism and quality work.
So let's learn how to use Angular's code coverage tools.
Step 1: Run the code coverage
For a quick start we'll use the code coverage option when running the test.
Like this.
ng test --no-watch --code-coverageAnd you should see a code coverage summary when the testing is finished.

You will notice that the summary has 4 main parts.
- Statements
- Branches
- Functions
- Lines
Here’s what the four metrics mean:
- Statements: These are individual instructions in your code that perform an action. Like assigning a variable. Calling a function. And so forth.
- Branches: These are the conditional branches (e.g.,
if,else,switch) tested. - Functions: The percentage of functions or methods tested.
- Lines: The percentage of individual lines of code tested.
In my case:
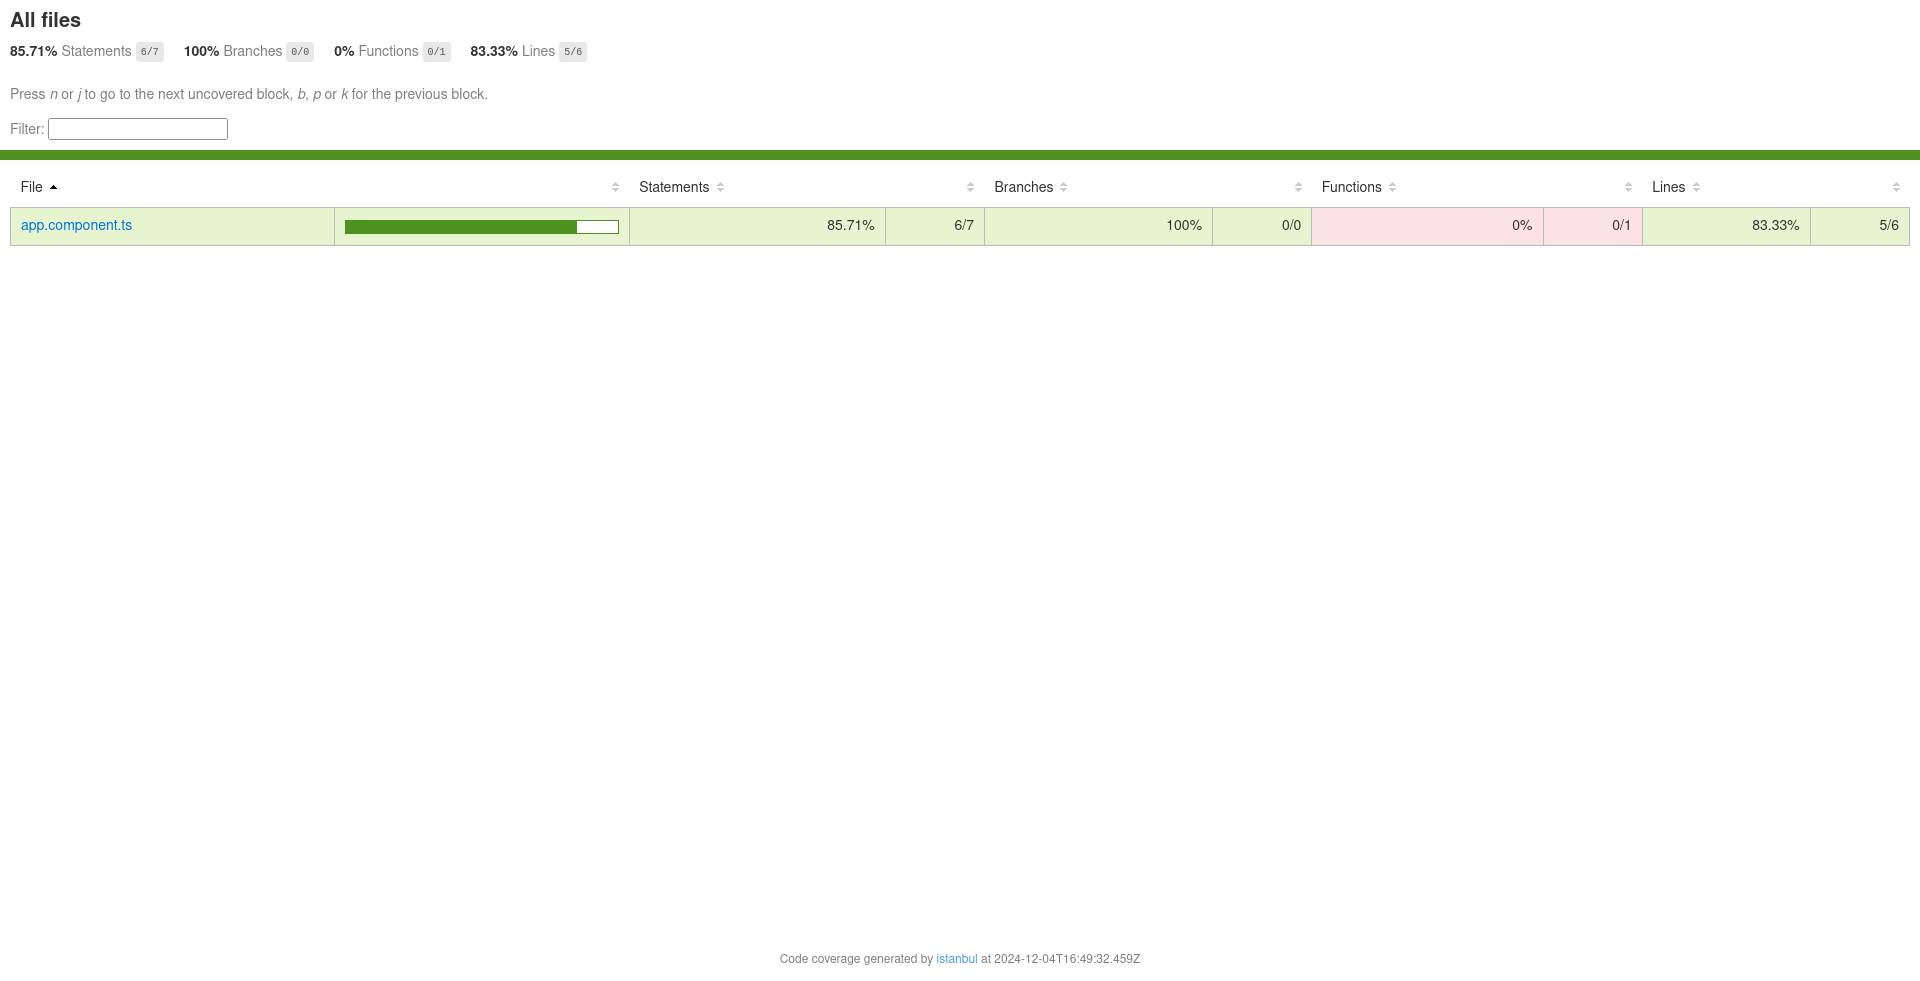
- Most statements are tested (85.71%).
- All branches are tested (100%).
- No functions are tested (0%).
- Most lines are tested (83.33%).
Step 2: Inspect the coverage folder
You'll notice that the --code-coverage flag also generated a folder coverage/project-name.
Inside this folder is an index.html file that we'll open in the browser for a deeper understanding of what parts of our code is being tested.
You should see a report like this in the browser.
👇 👇 👇

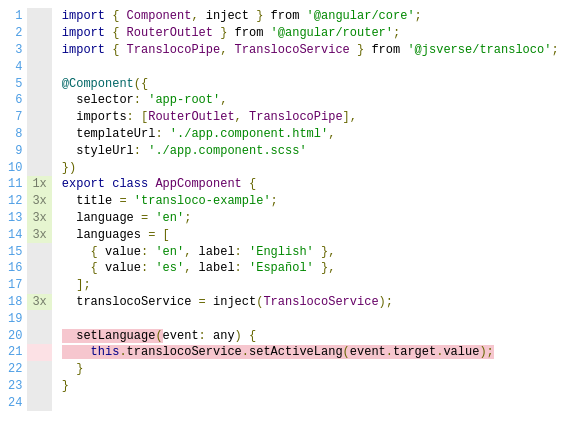
You can click on a file to get detailed information about how much of a specific code file is being tested or not.

Step 3: Configure automated code coverage reports
Now that we've looked at our code coverage reports how about we set up a way to be able to quickly see a code coverage report?
To do this, we're going to set up a code coverage badge in our README file. This will let us see at a quick glance how much of the code in our repository is currently tested.
ng generate config karmaWe will add a JSON reporter to the reporters array.
reporters: [
    { type: 'html' },
    { type: 'text-summary' },
    { type: 'json' }
]
Then install the badge generator
npm i coverage-badges-cli --save-devAnd then, we'll generate our badge using an NPM test script.
"test": "ng test --no-watch --code-coverage && coverage-badges --output ./badges/coverage-badge.svg --source ./coverage/<project-name>/coverage-final.json" And there you have it.
When we use npm run test we automatically get a generated badge of the test results.
Till next time,

Daniel Kreider - Angular Consultant & Developer
